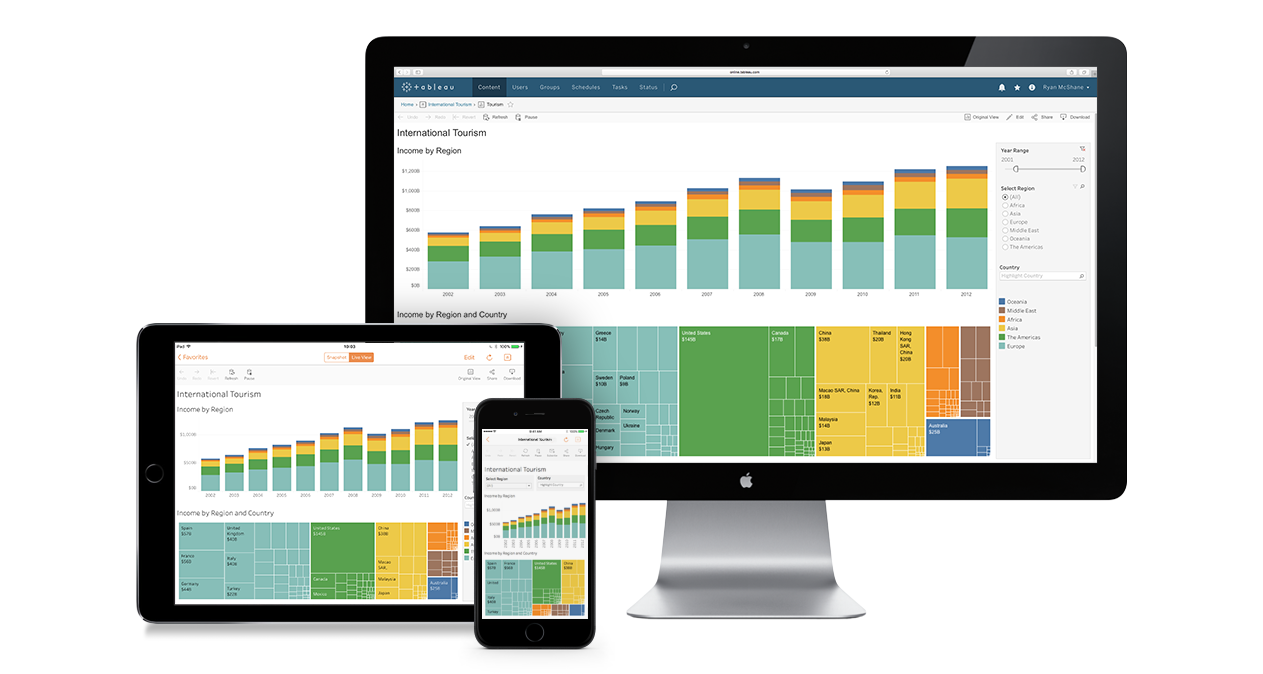


One of the coolest ways we can deliver data is Tableau. It's extremely flexible, it's fast and it looks amazing. Tableau can take any data we collect in near real time and allow the user to run analytics or understand that data in a visual form. Not only can you do the same type of 'rows-and-columns' reports you see in Excel, but you can visualize data in a whole different way: with graphs, charts, heat maps, geo maps and much more. This makes it more appealing and powerful than looking at a series of rows and columns.
Request Demo
Some customers choose to get their data in a feed. It's the raw data that is delivered to the customer on a scheduled basis. Many of our customers use this approach to manipulate the data inside their own BI (Business Intelligence) or CRM tools.
Request Demo
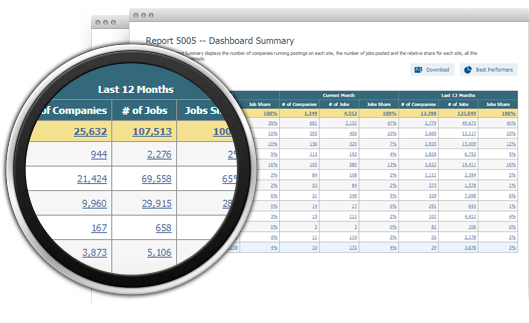
Many of our customers get their data delivered into a dashboard system or series of reports that we build for them. It's pre-canned and you can't go wrong with it. You log in, select what you're looking for, and the data that you want instantly appears on the page in front of you. It allows users to get in, get access to the data quickly, and get out.
Request Demo